Elasticsearch and Kibana must be on the exact same version. If you install Elasticsearch version 9.x, you must install Kibana version 9.x.
By default, Kibana only listens on the loopback interface, meaning it cannot be accessed from other machines on the network. Tactical Note: To make Kibana accessible externally, an administrator must change this to a specific IP or 0.0.0.0
Structured vs unstructured
Structured data :
Structured
The structured data is very organized and has a definite shape and format and fits the predefined data type patterns. It follows a defined schema and hence is easily searchable as it is well organized. The data you see in a database is considered to be structured data as before storing it in the database, it is expected to be following a strict schema.
Queries against structured data return results in exact matches. That is, we are concerned about finding the documents that match the search criteria but not how well they are matched.
Unstructured data
The unstructured data, on the other hand, is unorganized and follows no schema or no format. It has no predefined structure and hence cannot be easily searchable. The unstructured data is the bread and butter of most modern search engines. Examples of such unstructured data include blog posts, research articles, emails, PDFs, audio and video files and so on.
Elasticsearch offers full-text search capabilities, which allow you to search for specific terms or phrases within large amounts of unstructured text. Full-text (unstructured) queries will try to find resultsthat are relevant to the query. That is, Elasticsearch will search all the documents that are most suited for the query.
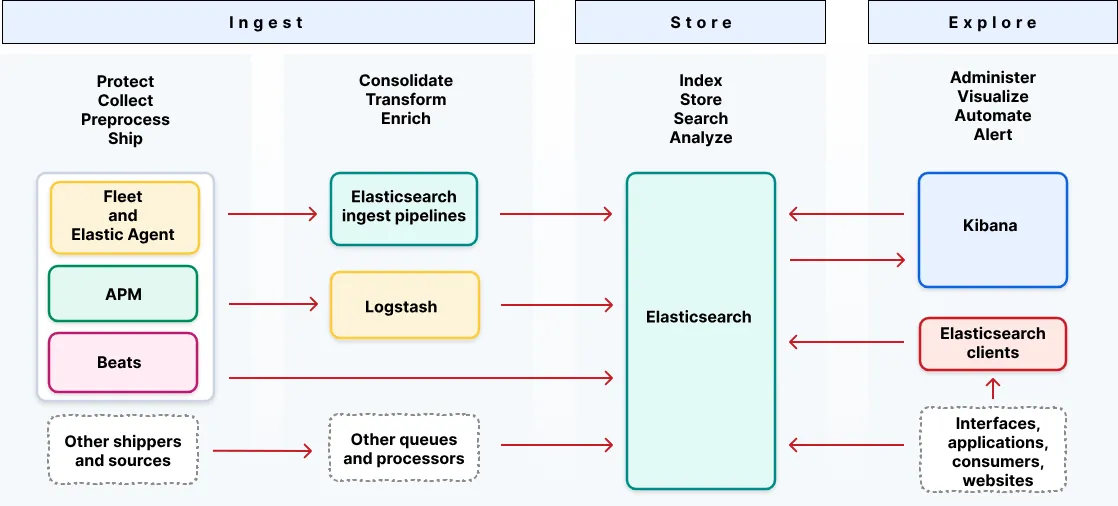
The suite of products is called Elastic Stack, which includes Kibana, Logstash, Beats, and Elasticsearch. It was formally called ELK Stack but renamed Elastic Stack after Beats was introduced into the product suite in recent years.
Agents :
Beats (Legacy/Specialized Shippers) :
Architecture: Decentralized, single-purpose lightweight binaries (e.g., Filebeat for logs, Metricbeat for stats, Packetbeat for PCAP).
Management: Requires local .yml configuration files on every single host.
Tactical Note: Environments relying on Beats are prime targets for local configuration manipulation. The decentralized nature means operators can often tamper with or drop local .yml files to blind specific log forwarding without alerting a central management plane immediately.
Elastic Agent (Modern/Unified Endpoint) :
Architecture: A single, unified binary that replaces all individual Beats.
Management: Centrally managed and configured via Kibana’s “Fleet” application. Policies are pushed dynamically to the endpoints.
Tactical Note: This is the highest threat to red team operations. Elastic Agent seamlessly integrates Elastic Defend, a fully-fledged EDR solution. Bypassing or blinding this agent is significantly harder as policy changes and agent health are actively monitored by the centralized Fleet server.
Visibility: Traces code-level execution, microservice hops, and exact database query latency rather than infrastructure metrics.
Tactical Note: APM dashboards and indices are high-value targets for data exfiltration. Because APM traces the exact execution flow of applications, poorly configured APM deployments frequently leak plaintext SQL queries, API bearer tokens, and sensitive user input directly into the Elasticsearch backend.
Data Directory (path.data): /var/lib/elasticsearch
Log Directory (path.logs): /var/log/elasticsearchTactical Note: These paths are high-value targets for post-exploitation. The data directory contains indexed databases (potential PII, credentials, business logic). The log directory is critical for enumerating application errors to chain further exploits or for anti-forensics (log tampering). Directory permission misconfigurations here present local privilege escalation vectors.
Network Exposure & Attack Surface
Bind Address (http.host): 0.0.0.0
Default Port: 9200 (Implicitly active)
Tactical Note: Binding to 0.0.0.0 exposes the REST API to all available network interfaces. Absent strict host-based or perimeter firewalls, this exposes the service to internal network sweeps or the public internet, facilitating credential brute-forcing, password spraying, or known CVE exploitation attempts.
Transport TLS (xpack.security.transport.ssl.enabled): true (Keystore: certs/transport.p12)
Tactical Note: Active X-Pack prevents unauthenticated data dumping and mitigates passive network sniffing (MiTM). Remote compromise requires valid credential acquisition, exfiltration of the .p12 keystores (assuming prior local access), or an unpatched unauthenticated RCE specific to the deployment version.
Dormant Settings & Operational Security
Memory Management: bootstrap.memory_lock is inactive. System memory can swap to disk under load, potentially leaving sensitive plaintext artifacts in the host’s swap partition.
Destructive Actions: action.destructive_requires_name is inactive (default). If administrative API access is achieved, an operator can execute wildcard index deletions (e.g., DELETE /*), enabling rapid data destruction operations.
Kibana Configuration /etc/kibana/kibana.yml
Executive Summary
The target Kibana instance is operating primarily on default parameters. The explicitly defined configurations are restricted to system-level logging and process management. The web interface is currently bound to the local loopback interface, restricting remote attack vectors and requiring a local pivot for direct interaction.
PID File: /run/kibana/kibana.pidTactical Note: The active JSON logging configuration indicates probable automated ingestion by a SIEM or log forwarder (e.g., Filebeat, Logstash). Operators must account for high-fidelity telemetry if interacting with or attacking this service. Tampering with or suppressing these logs requires root or the designated kibana service account privileges.
Service Port (server.port): 5601 (Default, dormant)
Request Limit (server.maxPayload): 1048576 bytes (1MB)
Tactical Note: Because the service binds to localhost, it is not externally exposed. To access the Kibana dashboard, an operator must establish a local port forward (e.g., via SSH tunneling or a C2 SOCKS proxy) on the host. The 1MB payload limit restricts large automated exploit payloads or bulk API interactions.
Credentials: Unconfigured / Dormant
Tactical Note: The elasticsearch.username, elasticsearch.password, and elasticsearch.serviceAccountToken fields are currently commented out. However, this file remains a high-value target during post-exploitation. If administrators eventually configure these fields for basic authentication, extracting the kibana_system credentials or bearer tokens grants direct, privileged interaction with the underlying Elasticsearch cluster, bypassing the Kibana frontend entirely.
Backend mTLS (elasticsearch.ssl): Unconfigured
Tactical Note: TLS is not currently enforced on the frontend. If an operator establishes a local pivot, or if administrators mistakenly bind server.host to 0.0.0.0 without simultaneously enabling SSL, all session cookies, administrative actions, and data queries will be transmitted in plaintext HTTP, making them highly susceptible to local packet capture and session hijacking.
Elastic Fleet Server
Phase 1: Initial Bootstrapping
Run this command from the extracted Elastic Agent directory on your dedicated Fleet Server node (10.10.30.11):
Phase 2: The Loopback Trap (The Problem)
The agent rejects the initial Kibana policy (due to strict SSL or IP misconfiguration) and falls back to 127.0.0.1:9200 or [::1]:9200 with a “connection refused” error. Meanwhile, the Kibana UI throws a 504 Gateway Timeout because the LXC container’s JVM memory is exhausted.
Phase 3: The Resolution Protocol1. Unchoke the Database (LXC Memory Clear)
On the 10.10.30.10 LXC container:
Open Kibana Dev Tools and drop ghost replicas to save CPU:
PUT _all/_settings { "index": { "number_of_replicas": 0 } }
2. Fix the Output Policy (The SSL Trap)
In Kibana, go to Management > Fleet > Settings > Outputs.
Edit the default output.
Set Host exactly to the DB: https://10.10.30.10:9200 (Not the .11 Fleet IP).
In the Advanced YAML box at the bottom, paste: ssl.verification_mode: none
Save and apply.
3. Break the Local Bootstrap Catch-22
The agent is locked offline and won’t download the Kibana fix. You must manually inject it into the local disk on the Fleet Server node (10.10.30.11):
Halt daemon: sudo systemctl stop elastic-agent
Edit local config: sudo nano /etc/elastic-agent/elastic-agent.yml
Update the outputs block to explicitly route and bypass SSL:
A structured branching strategy prevents untested or broken queries from knocking out production SIEM processing engines.
1. Feature Branch (Development / Experimental)
Purpose: Individual or collaborative workspace utilized to write, iterate, or update a specific detection logic rule.
Gates: The rule must pass successfully against known good datasets and specialized test datasets mapped to the precise adversary behavior being hunted.
Reviewed By: The individual detection engineer(s) authoring the detection.
2. Test Branch (Staging / Production Testing)
Purpose: Safely evaluate the functional performance of the new rule inside the production telemetry pipeline environment.
Gates: The detection must perform efficiently against real production data streams without causing log ingestion bottlenecks. The code must pass all automated linting checks (e.g., syntax/spacing validation) and contain complete initial documentation.
Reviewed By: The detection engineer(s) building the detection.
3. Stable Branch (Peer Review / Pre-Release)
Purpose: Peer-review phase to validate operational viability before final deployment.
Gates: Rule must prove performant against live production data. The rule’s structural documentation data and the exact alerts it generates must undergo complete peer review.
Reviewed By: The full detection engineering team.
4. Production Branch (Live Monitored Detections)
Purpose: Active live deployment running continuously inside the production architecture to protect the enterprise.
Gates: > * Peer-reviewed and explicitly approved.
100% fully documented (Metadata, remediation paths, and TTP tags completed).
Passed all automated quality review and reliability checks.
Verified false-positive rate that matches the assigned confidence and severity mapping rules.
Reviewed By: SOC Analysts (Final operational consumers of the generated alerts).