Transparent Tribe is a threat group that targets diplomatic, defense, and research organizations in India and Afghanistan. If your organization is a retail organization in the US, writing detections for Transparent Tribe is likely not to have a major impact on your defenses. However, writing detections for FIN7, a threat actor that targets organizations in the US retail, restaurant, and hospitality industries, typically through point-of-sale malware, would provide much more value as they are more likely to target your organization.
Threat actors will often go through hosting providers or cloud vendors to host their attack infrastructure. The provider of the infrastructure is likely, by default at least, to dynamically assign IP addresses. This means that one day an IP address could be assigned to a domain hosting a malware distribution site and the next it could be assigned to a legitimate business. For that reason, it is preferable to detect a domain rather than an IP address if possible.
What is Detection Engineering (DE)
The Concept: Detection Engineering is the discipline of designing, building, and tuning automated threat detection systems. It bridges raw telemetry and threat intelligence to create actionable security alerts without overwhelming operational teams.
Part 1: The Four-Step Detection Lifecycle
The systematic approach to building reliable, low-noise threat detections.
Discovery (Requirements Analysis): Evaluating specific threats to determine if current detection capabilities are sufficient. This involves identifying required telemetry sources and defining the notification parameters.
Design, Development, & Testing (Logic Creation): Translating threat intelligence into programmatic detection logic (e.g., SIEM queries, Sigma rules) and testing it in controlled environments to eliminate false positives.
Implementation & Monitoring (Production Deployment): Deploying the detection rule into the live environment. Continuous monitoring is required to ensure it does not negatively impact system performance or generate excessive operational noise.
Validation (Effectiveness Testing): Executing safe, simulated attacks against the network to verify that the detection logic triggers accurately under real-world conditions.
Part 2: The Enterprise Security Ecosystem
How Detection Engineering integrates with other specialized security functions.
Data Engineering: Responsible for the infrastructure. They build and maintain the pipelines that aggregate raw logs from endpoints, networks, and cloud environments into a centralized repository for analysis.
Detection Engineering: The logic creators. They consume the aggregated data to engineer specific rules and algorithms that identify malicious behavior within that telemetry.
SOC Operations: The incident responders. They monitor the alerts generated by Detection Engineering, conduct triage, and execute remediation protocols to neutralize threats.
Threat Hunting: The proactive analysts. Operating under an “assume breach” methodology, they manually search for stealthy threats that evaded automated detection. Successful hunts yield new intelligence, which is fed back to Detection Engineering to create new automated rules.
The Qualities of Good Detection
Core Principle: The definition of a “good” detection is subjective and varies based on an organization’s false positive threshold, adversary sophistication, and available visibility. Detections must be evaluated across three primary dimensions.
1. The Ability to Detect the Adversary (Effectiveness)
Evaluates the scope and longevity of the detection logic.
Coverage: The breadth of malicious activity the detection identifies, typically mapped to the MITRE ATT&CK framework. Broadening coverage across multiple techniques increases complexity but significantly improves the rule’s resilience.
Durability: The expected operational lifespan of the detection. This metric relies on understanding the volatility of the adversary’s infrastructure, tools, and procedures.
Mean Time to Detection (MTTD): The primary historical metric measuring the time elapsed from the initiation of the attack to successful detection.
2. The Cost to the Organization (Operational Overhead)
Evaluates the resource expenditure required to build, maintain, and respond to the alarm.
Creation & Maintenance: The engineering resources required to research and implement the rule. Detections require continuous review to prevent Staleness (monitoring outdated attack methods or decommissioned infrastructure).
Confidence vs. Noisiness:Confidence measures the probability of a true positive alert. Noisiness measures the volume of alerts that require no remediation. High confidence combined with high potential impact dictates alert prioritization.
Actionability & Specificity: A detection is only valuable if a SOC analyst can act upon it. Specificity (e.g., identifying the exact malware family rather than a generic machine-learning anomaly) directly drives the analyst’s ability to efficiently triage and remediate the threat.
3. The Cost to the Adversary (Imposed Friction)
Evaluates the difficulty and resource expenditure required for an attacker to evade the rule.
The Pyramid of Pain: Detections that rely on trivial indicators (e.g., file hashes or IP addresses) cost the adversary almost nothing to change. Detections targeting fundamental behaviors or C2 protocols force the adversary into costly re-engineering phases.
Exploiting Volatility: By targeting the least volatile (hardest to change) components of an attacker’s operational methodology, defenders maximize the cost of evasion and ensure the highest possible detection durability.
The Detection Engineering Life Cycle
Scenario Context: The internal Threat Intelligence team has identified that a sophisticated threat actor, FIN7, has shifted its evasion tactics. To bypass traditional email filtering, the adversary is now embedding malicious executables within TAR archives rather than standard ZIP files. The Detection Engineering (DE) team must engineer a robust rule to identify this specific execution chain.
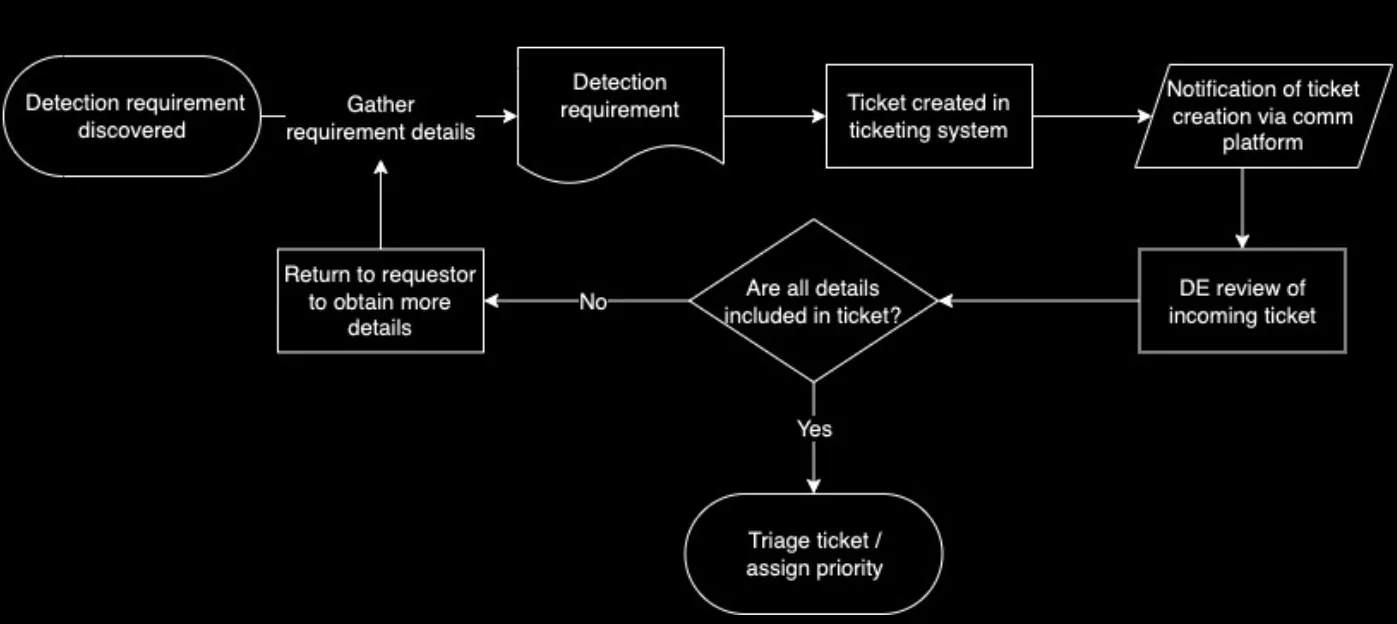
Phase 1: Requirements Discovery
The life cycle initiates by collecting and formalizing the exact parameters of the threat.
Inputs & Outputs:
Input: Findings from internal threat intelligence regarding the FIN7 TAR archive campaign.
Output: A complete detection requirement document detailing the requesting organization, description, reason, exceptions, scope, and evidence (e.g., OSINT blog post links and sample TAR files).
Phase 2: Triage
The requirement enters the backlog and must be prioritized against other pending tasks based on organizational risk.
Inputs & Outputs:
Input: The completed detection requirement.
Output: A triaged and prioritized task.
Triage Criteria:
The priority is determined by evaluating the threat severity, organizational alignment, current detection coverage, and the presence of active exploits. Because FIN7 actively targets the retail sector and the organization’s current defenses lack visibility into TAR extraction behaviors, this requirement is escalated to maximum priority.
Phase 3: Investigate
The requirement is converted into technical specifications. This phase requires rigorous planning across four distinct steps.
Inputs & Outputs:
Input: Triaged detection requirement.
Output: Technical specifications and data engineering requirements.
1. Identify the data source: > The engineer determines that endpoint process creation logs are required to observe archive utilities spawning executables. If logging is insufficient, a data engineering request is submitted.
2. Determine detection indicator types: > The engineer must select the appropriate indicator strategy for the rule based on the following classifications:
Type
Example Requirement
Detection System Requirements
Static
Detect communication with a recently identified phishing site, hosted at SiteA.com/login.php, with the IP address IPAddr1.
The ability to identify a specific IP address, URL, and domain name in any outbound traffic, and the host where the traffic originated.
Behavioral
Detect a web server process executing reconnaissance commands.
A maintainable list of web server processes, a maintainable list of reconnaissance commands, and the ability to identify processes, child processes, and security contexts.
Statistical
The volume of traffic from a single specified host to the internet that rises over a specified threshold within a specified timeframe.
The ability to monitor a moving aggregate of bytes sent from a single host, holding a configurable value for a data threshold, and comparing aggregate values against it.
Hybrid
Communication with a recently identified phishing site, hosted at SiteA.com/login.php, followed by anomalous login activity.
The ability to identify a specific IP address/URL in outbound traffic, combined with identifying login behavior varying from a normal baseline to determine outliers.
Decision: A Behavioral indicator is selected. The logic will monitor known archive processes (e.g., tar.exe) spawning child executable processes.
3. Research: > The engineer maps the attack to the MITRE ATT&CK framework and reviews historical telemetry to understand how legitimate administrators might use TAR archives, ensuring the detection avoids conflicting with normal operations.
4. Establish validation criteria: > The engineer defines exactly how the detection will be tested, stipulating the use of test data generated by extracting a sample malicious TAR file within a controlled sandbox environment.
Phase 4: Develop
The technical specifications are translated into actionable code within the SIEM.
Inputs & Outputs:
Input: Detection technical specifications.
Output: Detection code.
The Process:
Design: The engineer designs a query linking process execution logs for archive utilities to the creation of .exe files.
Development: The logic is written using the target system’s specific query language.
Unit Testing: The query is executed against a limited, static test dataset to verify syntax and baseline functionality.
Phase 5: Test
The development code is subjected to rigorous testing to validate efficacy and minimize noisiness before deployment.
Testing Datasets:
Known Bad: Telemetry representing the adversary’s activity (the sandbox extraction of the FIN7 TAR file).
Known Good: Telemetry captured from benign, everyday network activity.
Testing Goals:
Using test-driven development, the engineer runs the queries to:
Identify possible scenarios for false positives.
Identify potential for evading detection.
Identify possibly incomplete detections.
Phase 6: Deploy
The detection is migrated to production using a staged maturity model to protect analysts from alert fatigue.
Inputs & Outputs:
Input: Tested detection code.
Output: Deployed detection code.
Stage 1: Experimental
The rule is live, but alerts are restricted to the author. The engineer monitors the results to answer the following:
Does the detection code execute without errors?
Does the detection successfully trigger for the sample(s) provided as part of the detection requirement?
Given unrelated samples, do any false positives occur?
Is there any negative impact on system performance as a result of the rule?
Stage 2: Test
The alert is exposed to the broader SOC but tagged as low-fidelity. The team evaluates the following:
Does the rule trigger under expected conditions?
Does the rule conflict with or duplicate existing rules?
Is the false positive rate tolerable?
Has the broader team identified any ways to improve the detection?
Is the broader team comfortable with the quality of the detection?
Stage 3: Stable
The detection has proven its efficacy and efficiency. It is fully deployed, and the SOC treats alerts generated by this rule as actionable, high-confidence incidents.
Continuous Activities
The life cycle is supported by four ongoing activities that identify areas of improvement and feed back into Phase 1:
Monitoring: Continuously assessing deployed detections for unexpected behavior in real-world scenarios.
Maintenance: Updating detections as adversary tactics evolve over time.
Metrics: Performing statistical analysis on rule performance, trigger volume, and false positive rates.
Comprehensive Validation: Utilizing simulated attacks to identify coverage gaps and generate new detection requirements.
Detection Data Sources & Telemetry
Core Concept
Widespread detection coverage relies entirely on the quantity and quality of data sources. Relying on a single source (like endpoints) creates massive visibility gaps (like missing C2 network traffic). Data sources generally fall into two categories: Raw Telemetry (unprocessed event logs) and Security Tooling (processed alerts from AV, EDR, or Firewalls). Detection engineers primarily focus on Raw Telemetry.
Primary Raw Telemetry Sources
Windows Endpoints & Servers: Highly robust logging via Windows Event Logs. Key logs include Application, System, and Security (e.g., Event ID 4625 for failed logins). Advanced telemetry requires enabling PowerShell Script Block Logging and deploying Sysmon (for process hashes, network connections, etc.).
Linux Systems: Logs are stored in /var/log. Key files include syslog (global activity), auth.log or secure (authentication), and audit.log (file/syscall monitoring via auditd).
macOS: Utilizes centralized macOS Unified Logs.
Network Data: Essential for identifying drive-by downloads, C2 beacons, and lateral movement. Gathered via Packet Captures (full payload details, high storage cost) or Flow Data from routers/switches (metadata like IPs, ports, and sizes).
Cloud Assets (AWS/Azure/GCP): Cloud environments require specific telemetry like AWS CloudTrail to monitor API calls and resource access (e.g., unauthorized S3 bucket listing).
Applications & SaaS: Application-specific logs (Apache, database servers) and SaaS audit logs (Google Workspace, Office 365) are critical for monitoring authentication, permission changes, and web-based attacks (like SQL injection).
Data Source Challenges & Considerations
Completeness: Logs must contain actionable attributes (e.g., knowing a network connection occurred is useless without source/destination IPs).
Quality & Formatting: Data must be reliable, trustworthy, and properly formatted (e.g., JSON) so the SIEM can parse it.
Timeliness: Post-processing or network delays can cause a lag between when an event occurs and when it reaches the detection engine, impacting response times.
Coverage & Resilience: Visibility gaps occur if critical assets aren’t forwarding logs. Logging pipelines must be resilient, with fallback mechanisms to ensure evidence isn’t lost during outages.
High (Score 7): Undetected web shell active on Linux server. (Severity 2 + Align 3 + Cov 2). Action: High priority engineering queue.
Rejected (Score 0): Urgent intel report regarding macOS malware in a 100% Windows AD network. Action: Dismissed due to Alignment = 0.
Detection as Code: The Sigma CI/CD Pipeline
Elite Blue Teams use automated pipelines to push Sigma rules to their SIEMs. Understanding this flow reveals where their blind spots are.
1. Lint (The Grammar Check): An automated script checks the raw Sigma YAML for typos, spacing errors, or invalid fields. If a SOC analyst forgets a quote mark, the pipeline stops here.
2. Compile (The Translation): The pipeline runs sigma-cli automatically. It takes the YAML file and converts it into native Elastic KQL or Splunk SPL, exactly like we did with Uncoder.
3. Test (The Firing Range):(Crucial for Red Team) The pipeline automatically spins up a disposable VM, executes the compiled rule, and runs a simulated attack (usually via Atomic Red Team) to see if the rule actually catches the attack. If the alert fires, it passes.
4. Publish (The Vault): The compiled, tested SIEM rule is saved as an artifact in a repository. This creates a “known good” version history.
5. Deploy (Going Live): An API key pushes the compiled KQL directly into Kibana’s live detection engine. The trap is now set in production.
Lab: Documenting a Detection (Qakbot MOTW Bypass)
Primary Audience: SOC analysts reviewing alerts or detection engineers updating the rule.
Metadata
Name: ISO mounted from ZIP file in temporary directory
Author: Jason Deyalsingh
Creation Date: 1/30/2023
Revision History: Initial Release
Maturity: Test
License: MIT
Ticket: N/A
Detection Details
Description: Mark of the web tags exist on Windows operating systems, to inform the user and system when certain files were downloaded from the internet. These tags attempt to block or otherwise subvert certain potentially unsafe actions from being performed. Mark of the web bypass techniques attempt to deliver files to the end user without this tag set, allowing potentially unsafe actions to be taken. This detection identifies an ISO mounted from a ZIP file existing in a temporary directory, which is a procedure used by Qakbot after performing a MOTW bypass.
Rule Format: EQL
Rule:
any where event.code=="1" and winlog.channel=="Microsoft-Windows-VHDMP-Operational" and winlog.event_data.VhdFileName like~ ("*Temp*","*.zip*","*.iso")
Related Detections: Wermgr running reconnaissance commands
Analyst Guidance
Severity: Medium
Confidence: Medium
Investigation Suggestions: The ISO run within the temporary directory should be investigated as possible malware. Attempt to identify and evaluate the carrier email message that delivered the ISO as a possible phishing email or investigate the domain or website the ISO was downloaded from. Continue to monitor the endpoint for the Wermgr running reconnaissance commands alert, which identifies suspicious activity that has been seen occurring after this activity and can be used to confirm the threat as a true positive.
Responses or Remediations: If confirmed as malicious activity, contain the endpoint before remediating. Check all outgoing network connections from the endpoint to identify possible C2. This activity has been associated with ransomware activity and lateral movement using Brute Ratel and Cobalt Strike.
False Positives: Users can legitimately download a zipped ISO file as a developer or network admin role.
Composite Alerting
Definition: A high-fidelity alert generated by linking multiple low-fidelity (low-severity) alerts together using shared metadata tags (like a user ID, IP address, or correlation ID).
Why it’s used: It prevents alert fatigue. A single obfuscated PowerShell command might just be an IT script (Low-Level Alert). But PowerShell followed by an outbound connection to an unknown IP (Low-Level Alert) equals a high-confidence C2 beacon (Composite Alert).
The Dependency Failure (Detection as Code) LL1-Tag).
If a detection engineer updates a low-level rule and accidentally changes the field name to Tag-LL1, the low-level rule will still pass its individual unit tests, but the Composite Alert will silently fail in production. This is why Detection-as-Code pipelines test the entire chain, not just individual rules.
Composite alerts rely on strict schema matching (e.g., both low-level alerts must output a field called
Threat Validation & Coverage Engineering
Core Concept: Security validation results are rarely black-and-white. Quantifying defense effectiveness requires differentiating between specific tool signatures and foundational attack procedures.
When an attack simulation fails to trigger an alert, triage the failure using a three-step filtering process before creating a new rule requirement:
Step A: Filter Out Simulation Failures: Ensure the security testing tool actually executed the attack technique correctly. If the script itself crashed, it is not a detection gap.
Step B: Assess Telemetry Visibility: Determine if the required logs exist. If you lack network logs capturing FTP data transfer sizes, a missed exfiltration alert is an architectural blind spot, not a missing rule gap. You must decide whether to expand telemetry or accept the risk.
Step C: Evaluate Existing Rules: Determine if a rule already exists for the technique (e.g., Scheduled Tasks). If it does, do not write a duplicate rule. Instead, update the existing logic to fix syntax bugs or expand a narrow scope.
2. The Choke Point Strategy & Durability
Detections targeting fragile indicators (like file hashes, IPs, or specific open-source logging artifacts like RemComSvc_Logs.log) possess low durability. Attackers can easily bypass them by recompiling or modifying strings.
The Goal: Focus on Choke Points—the functional indicators on an X/Y axis that feature the absolute least amount of operational variability. These represent mandatory actions an adversary cannot avoid performing to successfully execute a technique.
3. The Trap: Validating Tools vs. Procedures
The Flaw: Writing rules targeting a specific tool (e.g., a specific Red Team C2 configuration) skews metrics. A SOC might detect 100% of a Red Team’s actions because they matched the specific C2 infrastructure network traffic, yet remain completely blind to the actual execution procedures.
The Reality: Real adversaries will modify their tools and infrastructure. To achieve accurate metrics, validation tests must vary at the procedure level, testing the functional bounds of the attack space rather than specific static indicators.
4. The Four States of Procedure Coverage
Coverage State
Test Result
Test Variance / Boundary Definitions
Fully Detected
All tests for the procedure pass.
Tests successfully vary across all valid bounds of detection indicators.
Partially Detected
A subset of validation tests pass.
Tests vary across valid bounds; some reveal critical gaps in the logic rules.
Missed Coverage
All validation tests fail.
A single test of a known procedure fails entirely to trigger any alert.
Zero Days
N/A (Untestable state).
Unknown procedures that are not yet researched or covered by current logic.
5. Practical Implementation & Roadmap Metrics
Validation pipelines output two distinct types of production metrics:
Validation Coverage Metrics: Quantifies how many total techniques have unit tests built for each known procedure, alongside edge cases.
Validation Pass-Rate Metrics: The raw mathematical percentage of unit tests and edge-case variants that your current logic successfully triggers against.
Operational Roadblocks: Be aware that pursuing 100% coverage hits clear limits: it requires deep engineering resources, introduces severe false-positive noise from standard system administration activity, and demands robust baseline telemetry.
Performance Management in Detection Engineering
Core Concept: Assessing how well a detection engineering program is performing by measuring its maturity, efficiency (productivity), and effectiveness (success against adversaries).
1. Detection Program Maturity Model (CMMI Aligned)
Level 1: Relying solely on third-party/vendor detections (SIEM/EDR default rules).
Level 2: Building custom detections based on Open Source Intelligence (OSINT) and public reports.
Level 3: Creating/updating detections based on internal SOC analyst feedback.
Level 4: Metrics-driven detection creation (optimizing based on efficiency/efficacy data).
Level 5: Proactive internal research to discover new attack procedures and custom choke points.
2. Efficiency Metrics (Inward-Facing)
Measures productivity and the operational tax placed on the SOC.
Velocity (Story Points): Agile metric measuring team productivity over time. Useful for forecasting backlogs, but not for evaluating actual security value.
Alert Count: The raw number of alerts that actually require human review. Helps identify excessively noisy rules.
Average Time Claimed: Time taken to disposition an alert.
High value: Missing evidence or poor documentation.
Variability in Time Claimed: High standard deviation means some analysts know how to investigate it, while others struggle (indicates a training or runbook gap).
Measures how well the SOC is stopping attacks and retaining coverage.
MTTD (Mean Time to Detect): A popular but purely historical metric. It only measures attacks you successfully caught and depends entirely on the attacker’s op-tempo. It is useless for predicting future defense capability.
ROC Curves (Precision vs. Recall): Plotting True Positives against False Positives to evaluate different rule thresholds. Helps find the sweet spot between catching the attacker and flooding the SOC with noise.
Low-Fidelity Coverage: Coloring the MITRE ATT&CK matrix based on rule counts. Easy to do, but misleading (1 good rule is better than 10 bad ones).
Detection Drift (False Negative Tracking): Tracking when a subset of layered defenses fails. By assigning a “Minimum Detections” (MD) tag (e.g., if a C2 beacon should trigger 4 different alerts but only triggers 2), you can mathematically calculate “drift” and identify when adversaries have altered their procedures.
Detection Volatility: Measures how often a rule requires updating.
High Volatility: The rule relies on fragile indicators (like file hashes) that the adversary changes constantly.
Low Volatility: The rule successfully targets an operational “choke point.”